We are a specialist company dedicated to the supply or supply and installation of high quality professional irrigation equipment. Most products are made in Europe and are made from high quality materials suited to industrial environments. This however does not mean that the equpment is more expensive than the key domestic brands. It does in actual fact mean that we can supply a higher quality more durable product at much lower prices that the key domestic type systems. We work with landscapers and installers offering a commercial grade irrigation solution for all situations. From greenhouse watering and misting to sports and domestic irrigation. We have 40 years of experience working in the Horticultural industry.

At Easy Irrigation we hold all our products in stock so that it is available for a very swift desptach.
We gurantee your total satisfaction and will always put you our customer first. Our well trained staff have many years of experience in Horticulture, Agriculture, Parks, golf and domestic irrigation. Our experience extends beyond just watering and covers many areas of horticulture. Call us today on 01189736905 no matter how small the problem and with our vast range of stock we should be able to help you.
All pumps that move liquids have very different characteristics. Some of these are designed so that the pump performs a particular job efficiently and others are from poor design. A pond pump when compared next to a pressure pump would be an extreme example of pumps that are made for a purpose . A pond pump may have less than 1 bar of pressure but will pump 25,000 litres of water per hour while the pressure pump will move 4500 litres at a 4 bar head.
An example of poor design in a pressure pump. One model with an 800 watt electric motor will pump 3000 litres per hour at a 3.5 bar head while another will have a smaller size electric motor and pump 4500 litres per hour at 4.5 bar head.
From this information we can see that it is very important to understand what a pressure pump can deliver rather than its horse power or motor wattage.
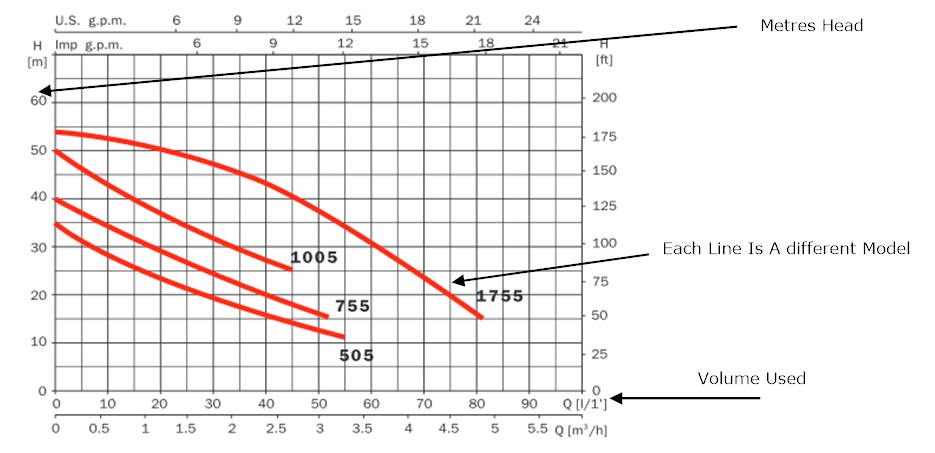
This simple pump performance chart tells us all we need to know about this particular type of pump.
In the example below we will assume that we are using
If I turn the 505 pump on and no sprinklers are running we will have a 35 metre head ( 3.5 bar) and zero flow.
I now turn on 1 sprinkler. My flow is 500 litres per hour or 500 divided by 60 minutes = 8.33 litres per minute. Put your finger on the left corner of the horizontal line. Move your finger right until you reach .5 Now move your finger straight up until it touches the red 505 models line and then read the metres head pressure. You will see that it has now dropped to about 29 metres head or 2.9 bar
I now turn on 2 sprinklers and repeat the process above but this time I move my finger along the horizontal line to the number 1 or 1 cubic metre per hour which is the same as 1000 litres per hour ( 2 sprinklers 500 litres per hour each = 1000 litres). I can now see that the pressure has dropped to between 23 and 24 metres head ( 2.3 and 2.4 Bar)
That is the basics. There are many other things that we would need to build in to the calculation like filters, valves, length of pipe so this should be taken as a guide